Formation of the Pattern
The bearish flag pattern is a technical analysis formation that indicates a potential continuation of a downtrend in the financial markets. It is formed by two main components: a flagpole and a flag.
Formation Mechanism
Initial Downtrend (Flagpole Formation)
Strong Selling Pressure: The bearish flag pattern usually starts with a significant downward movement, forming the flagpole. This is often triggered by negative fundamental news, such as poor corporate earnings reports, weak economic data, or changes in industry regulations. These factors cause investors to become pessimistic, leading to a large – scale sell – off. As a result, the supply of the asset significantly exceeds the demand, pushing the price down sharply.
Establishing the Trend: The rapid decline in price during the flagpole formation sets a clear downtrend. This initial move alerts technical traders to the potential for a continued bearish trend, and they start to look for confirmation patterns, such as the bearish flag, to enter short – selling positions.
Consolidation Phase (Flag Formation)
Profit – Taking and Short – Covering: After the sharp decline, some traders who sold early take profits, and short – sellers may cover their positions to lock in gains. At the same time, some bargain – hunters may enter the market, believing the price has fallen far and fast. This combination of profit – taking and short – covering creates a temporary balance between buying and selling pressure, leading to a consolidation period.
Psychological Resistance: The flag formation also reflects a period of indecision in the market. While the overall trend is bearish, some traders are still hesitant to continue selling, and others are hoping for a reversal. This psychological tug – of – war results in the price moving within a relatively narrow range, forming the characteristic rectangular or parallelogram – like shape of the flag.
Breakdown and Continuation of the Downtrend
Exhaustion of Bullish Sentiment: As the consolidation phase progresses, the buying pressure from bargain – hunters and short – covering gradually diminishes. The bearish sentiment eventually takes over again, as the fundamental factors that initially drove the downtrend still remain. When the selling pressure exceeds the remaining buying support, the price breaks below the lower trend line of the flag.Confirmation and Momentum Build – Up: The breakdown is usually accompanied by an increase in trading volume, which confirms the resumption of the downtrend. The increase in volume indicates that more traders are entering the market to sell, adding to the downward momentum. As the price continues to decline, it attracts more short – sellers, further fueling the bearish trend and potentially reaching the projected price target based on the height of the flagpole.
Technical Significance
The bearish flag pattern is a crucial technical indicator in financial markets, carrying significant implications for traders and investors. Here are its main technical significances:
Trend Continuation Indicator: The bearish flag is primarily recognized as a reliable signal for the continuation of a downtrend. It forms during a temporary pause in a downward – moving market, suggesting that the selling pressure is likely to resume after a period of consolidation. When the price breaks below the lower trend line of the flag, it confirms the bearish outlook, indicating that the previous downtrend is likely to continue. This allows traders to anticipate further price declines and potentially profit from short – selling opportunities.
Entry and Exit Signals for Traders: The formation of the bearish flag provides specific entry and exit points for traders. The breakdown of the lower trend line of the flag is a common entry signal for short – positions, as it indicates the resumption of the downtrend. Traders often place stop – loss orders above the upper trend line of the flag to limit potential losses in case the market moves against their position. Additionally, the projected price target, estimated by measuring the length of the flagpole and subtracting it from the breakdown point, can serve as a rough guide for determining the exit point to lock in profits.
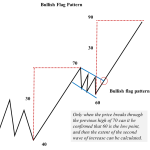
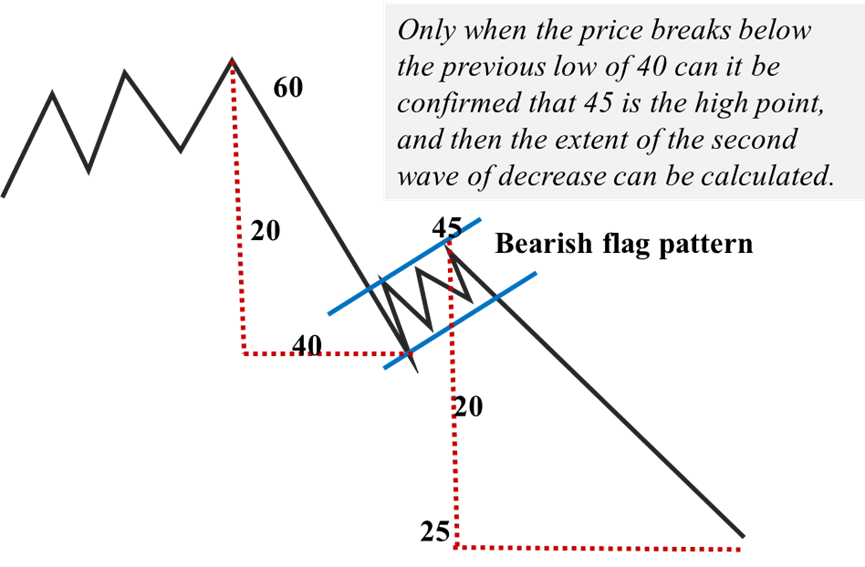
Calculation Method
How to predict the potential decline of the stock price through powerful technical analysis?
- The calculation of the first – wave decrease. As shown in the above chart, 60-40=20.
- The calculation of the second- wave decrease target. As shown in the above chart, the target of the second – wave decrease is 25, 45-20=25.
In this chapter, we will use two cases. One is the case of the price trend of Bitcoin, and the other is the significant decline of the Nasdaq 100 Index in 2025.
Case1 BTC (2021-2022, Daily Chart)
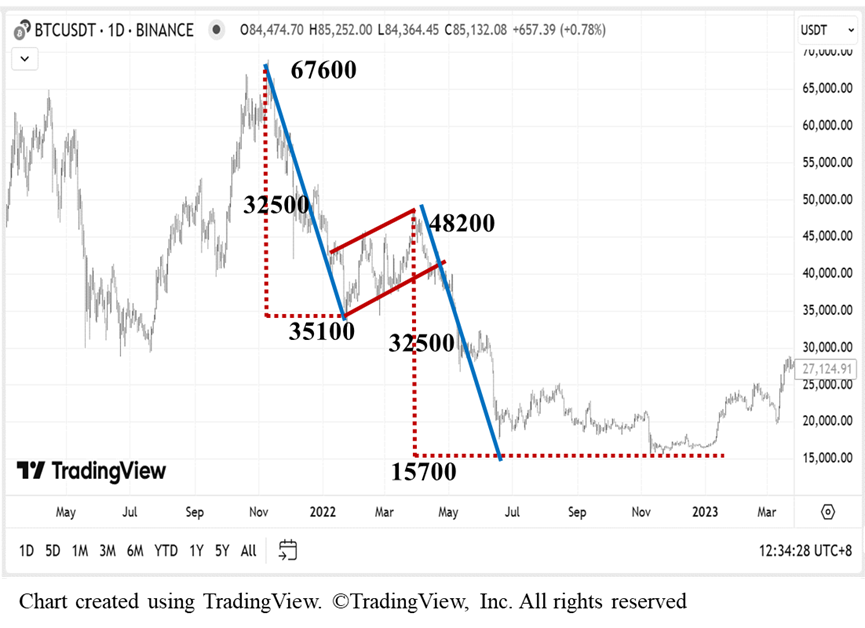
How to predict the potential decline of the Bitcoin price through powerful technical analysis?
- The calculation of the first – wave decrease. As shown in the above chart, 67600-35100=32500.
- The calculation of the second- wave decrease target. As shown in the above chart, the target of the second – wave decrease is 15700, 48200-32500=15700.
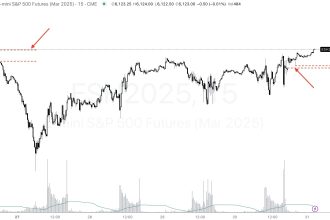
Case2 NDX (2025, Daily Chart)
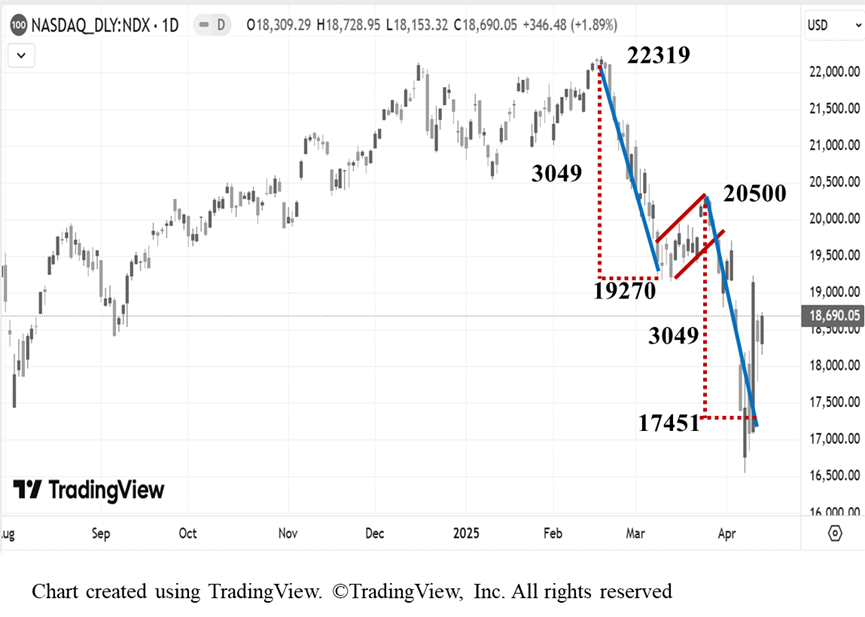
How to predict the potential decline of the Nasdaq 100 index through powerful technical analysis?
- The calculation of the first – wave decrease. As shown in the above chart, 22319-19270=3049.
- The calculation of the second- wave decrease target. As shown in the above chart,the target of the second – wave decrease is 17451, 20500-3049=17451.
Although on Black Monday in April, due to a significant market panic, the final low was below 17000, the market rebounded sharply in the following two days.
Interpretations of other chart patterns are available in chart patterns