Formation of the Pattern
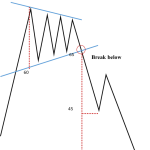
The symmetrical triangle is formed by two gradually converging trend lines. The upper trend line is a downward-sloping resistance line, and the lower trend line is an upward-sloping support line. After the stock price has been fluctuating and consolidating within the triangle for a certain period of time, when it finally breaks through the upper trend line (resistance line) effectively, the symmetrical triangle pattern with an upward breakout is formed.
Formation Mechanism
It is composed of two gradually converging trend lines.
The upper trend line is a downward-sloping resistance line, which means that during the upward movement of the stock price, there is continuous selling pressure above to prevent the stock price from rising further, causing the high points of each rebound to gradually decrease.
The lower trend line is an upward-sloping support line, indicating that when the stock price drops, there is a certain amount of buying power below, making the low points of each pullback gradually rise. However, as time goes by, the gap between the bullish and bearish forces gradually narrows, and the price fluctuation range becomes narrower and narrower, forming a convergent trend.
Confirmation Methods
Shape Recognition Converging Trend lines: The most prominent feature of a Bullish Symmetrical Triangle is the presence of two converging trend lines. The upper trend line connects the lower highs of the price movements, while the lower trend line connects the higher lows. As the price action progresses, these two trend lines gradually converge, forming a triangular shape. This convergence indicates that the trading range is narrowing, and the market is consolidating.
Volume Analysis
Declining Volume: As the Bullish Symmetrical Triangle pattern develops, trading volume typically declines. This is because as the price range narrows and the market consolidates, there is less uncertainty and fewer trading opportunities, leading to a decrease in trading activity. The declining volume is a sign that the market is in a period of indecision and is gathering energy for a potential breakout.
Volume Spike on Breakout: When the price finally breaks out above the upper trend line of the triangle, there should be a significant increase in trading volume. This volume spike confirms the validity of the breakout, indicating that there is strong buying interest and that market participants are actively entering the market to push the price higher. A breakout without a corresponding increase in volume may be a false signal and should be treated with caution.
Price Confirmation
Breakout above the Upper Trend line: The most crucial confirmation of the Bullish Symmetrical Triangle is the breakout of the price above the upper trend line. This breakout should be a clear and decisive move, with the price closing above the upper trend line for at least one trading period (preferably more). A weak or tentative breakout, where the price only briefly touches or slightly exceeds the upper trend line and then quickly retreats, is not considered a valid confirmation.
Retest of the Broken Trend line: After the breakout, the price often retraces back to the broken upper trend line, which now acts as a support level. This retest is an important confirmation step. If the price successfully holds above this support level and then resumes its upward move, it further validates the Bullish Symmetrical Triangle pattern and the breakout. The retest provides an opportunity for traders who missed the initial breakout to enter the market at a more favorable price.
Technical Significance
A Signal of Trend Reversal: The Bullish Symmetrical Triangle pattern at the bottom often appears at the end of a downtrend and serves as a potential signal of a trend reversal. It indicates that after a period of decline in the market, the forces of the bulls and the bears are gradually tending towards equilibrium. The selling pressure is weakening, while the buying power is increasing. Although the two sides are still in a stalemate, they are accumulating strength for the trend reversal. Once the price effectively breaks through the upper trendline of the triangle, it often signals the end of the downtrend and the beginning of an uptrend. This provides investors with an important signal of the trend reversal, enabling them to make early arrangements and grasp the new upward market trend.
Confirmation of Support and Resistance Levels: The trend lines that form the Bullish Symmetrical Triangle Pattern act as important support and resistance levels. The lower trend line acts as a support level, indicating that buyers are stepping in at that price level to prevent the price from falling further. Conversely, the upper trend line serves as a resistance level until the price successfully breaks through it. Once the breakout occurs, the previously broken resistance level often turns into a support level, providing further confirmation of the pattern’s validity and offering additional support for the upward move. These well – defined support and resistance levels help traders in determining optimal entry and exit points, as well as in assessing the overall strength of the price move.
Trading Strategies
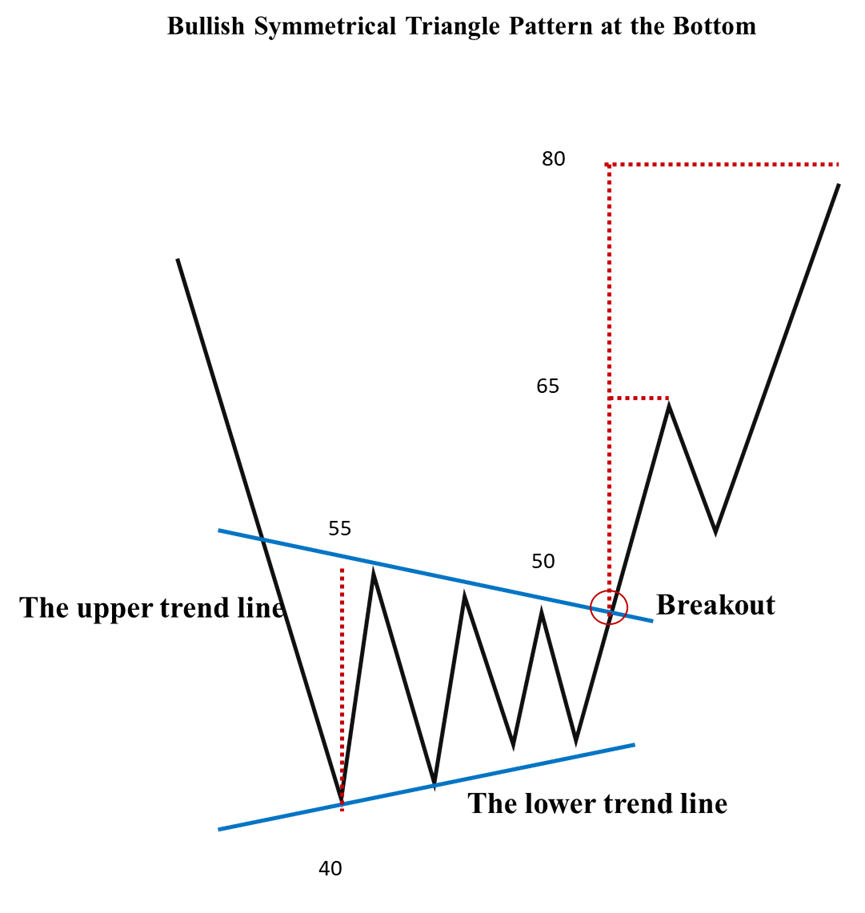
By measuring the height of the Bullish Symmetrical Triangle at the bottom (usually the vertical distance from the vertex of the triangle to the bottom), the potential upward target of the price after the breakout can be roughly predicted. Generally speaking, after the price breaks through the upper trend line, it may rise by an amplitude equivalent to the height of the triangle. This provides investors with a reference for the target price, helping them formulate profit targets and take-profit strategies, and thus better plan their investment returns.
Calculation Method
How to predict how far of the stock price will rise through powerful technical analysis?
(1) The vertical distance from the vertex of the triangle to the bottom. As is shown in the above chart, 55-40=15.
(2) Once the price breaks through the neckline, theoretically, the price is expected to rise by at least an amplitude equal to this vertical distance. 50+15=65, 65+15=80
In this chapter, we will use three cases. The first one is the exchange rate of the US dollar against the euro. The second case is about Pinduoduo. And the last one is the stock price pattern of the fintech company Payoneer.
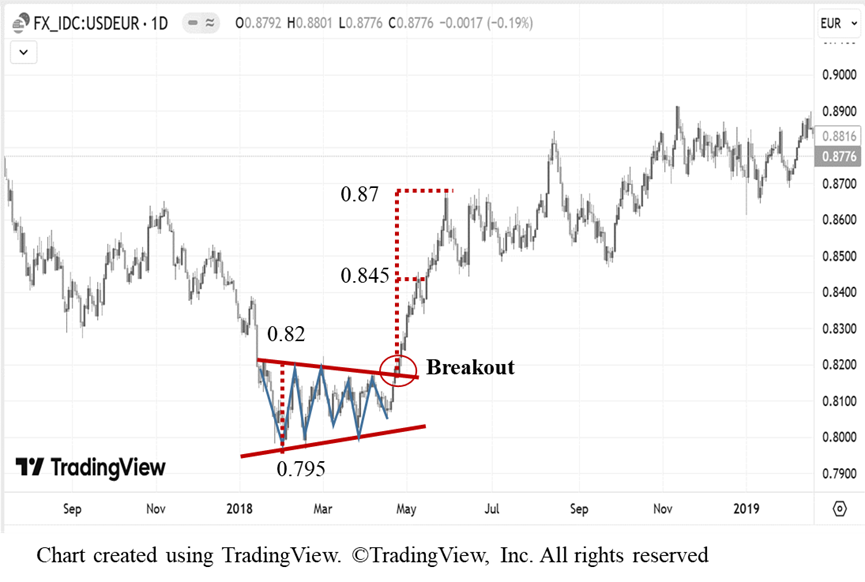
Case1 USD/EUR (2018, Daily Chart)
How to predict how far of the USD/EUR will rise through powerful technical analysis?
(1) The vertical distance from the vertex of the triangle to the bottom. As is shown in the chart, 0.82-0.795=0.025.
(2) Once the price breaks through the neckline, theoretically, the price is expected to rise by at least an amplitude equal to this vertical distance. 0.82+0.025=0.845.
(3)After the price reached 0.845, there was a slight pullback, and then it started to rise sharply.0.845+0.025=0.87
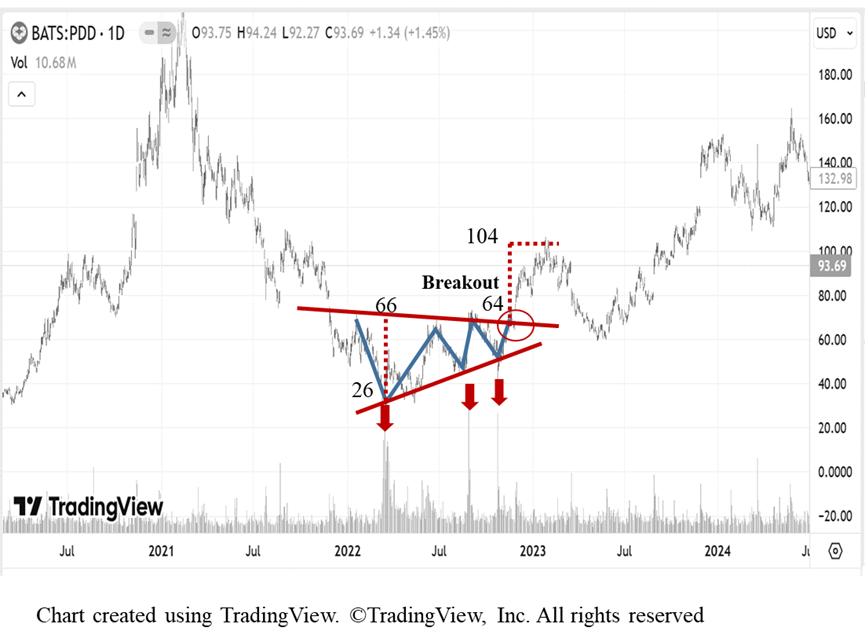
Case2 PDD (2018, Daily Chart)

How to predict how far of PDD stock price will rise through powerful technical analysis?
(1) The vertical distance from the vertex of the triangle to the bottom. As is shown in the chart, 66-26=40.
(2) Once the price breaks through the neckline, theoretically, the price is expected to rise by at least an amplitude equal to this vertical distance. 64+40=104.
Case3 PAYO (2022-2024, Weekly Chart)
How to predict how far of PAYO stock price will rise through powerful technical analysis?
(1) The vertical distance from the vertex of the triangle to the bottom. As is shown in the chart, 8-4=4.
(2) Once the price breaks through the neckline, theoretically, the price is expected to rise by at least an amplitude equal to this vertical distance. 5.9+4=9.9.