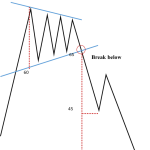
Formation of the Pattern
The head and shoulders bottom is a typical reversal pattern, usually appears at the end of a downtrend, indicating that the market trend is about to change from a decline to an upward movement. The head and shoulders bottom pattern is composed of the left shoulder, the head, the right shoulder, and the neckline. In a downtrend, a relatively small rebound low point appears first, forming the left shoulder. Subsequently, the price continues to decline to a lower point, forming the head. Then, the price rebounds again and then drops once more, but the low point of this decline is higher than the low point of the head, forming the right shoulder. , connecting the high points of the left shoulder and the right shoulder forms the neckline.
Formation Mechanism
Left Shoulder: In a downtrend, the price experiences a small rebound, forming the left shoulder. At this time, the market is still dominated by bears, but the downward momentum weakens, and bulls start to attempt a counterattack.
Head: After the left shoulder, the price continues to decline and reaches a new low, forming the head. During this stage, panic spreads in the market, and bearish forces reach their peak. However, it also means that bearish forces are about to be exhausted, which is a signal that the market may reverse.
Right Shoulder: After the head is formed, the price rebounds again, and the rebound height exceeds the low point of the left shoulder, forming the right shoulder. At this time, bullish forces gradually increase, and the market begins to show signs of reversal. The price no longer reaches a new low, indicating that bearish forces can no longer dominate the market.
Neckline: Connecting the high points of the left shoulder and the right shoulder forms the neckline. The neckline is a key resistance level in the head and shoulders bottom pattern. When the price breaks through the neckline effectively, it marks the completion of the head and shoulders bottom pattern, and the market trend will change from a downtrend to an uptrend.

Confirmation Methods
Shape Completion. Three Lows and Two Necklines: The head and shoulders bottom pattern consists of three distinct lows. The middle low (the head) is deeper than the two surrounding lows (the shoulders). There are also two necklines that connect the highs between the lows. First, the pattern is only considered potentially valid when these three lows and the general shape start to take form. Then, as the price moves above the neckline, it further validates the pattern. For example, in the chart of a certain stock, after forming the left shoulder, the price pulls back and then creates a lower low (the head), followed by another rebound and a subsequent low that is higher than the head (the right shoulder).
Neckline Resistance Turned Support. Successful Test: After the price breaks above the neckline, the neckline should act as support when the price pulls back. If the price retraces to the neckline and then bounces off it, rather than breaking below it, this confirms the validity of the pattern. For example, if a stock breaks above its neckline at $37 and then pulls back to $39 – $40 in a subsequent correction but does not fall below $37, it shows that the neckline has effectively become a support level, strengthening the case for the head and shoulders bottom pattern being a true reversal signal.
Technical Significance
Signal of Trend Reversal: The Head and Shoulders Bottom Pattern is an important bullish reversal pattern, typically emerging at the end of a downtrend. When this pattern forms in the price movement, it implies that the bearish momentum in the market is weakening, and the bullish forces are gradually gaining the upper hand. As a result, the price trend is likely to shift from a downward direction to an upward one. For instance, in a sustained downtrend, there is initially a relatively deep bottom (the left shoulder). Subsequently, the price rebounds, and then it drops again to create a new low (the head). However, the subsequent decline shows a significantly weaker momentum, forming a relatively higher bottom (the right shoulder), thus taking the initial shape of the Head and Shoulders Bottom Pattern, indicating that the downtrend may be coming to an end soon.
Confirmation of Market Sentiment Shift: From the perspective of market sentiment, the Head and Shoulders Bottom Pattern reflects the change in the sentiment of market participants. During a downtrend, investors are generally in a pessimistic mood, continuously selling stocks and driving the price down. But as the Head and Shoulders Bottom Pattern takes shape, especially during the formation of the right shoulder, although the price is still declining, the selling pressure is notably reduced, which shows that investors’ pessimistic sentiment is starting to fade away. When the price breaks through the neckline (the straight line connecting the peak of the rebound of the left shoulder and the head), more investors begin to join the bullish camp, further pushing the price up and confirming the shift of market sentiment from pessimism to optimism.
Trading Strategies
The Head and Shoulders Bottom Pattern offers clear trading opportunities for investors. When the price breaks through the neckline, it is an important buying signal, and investors can enter the market at this time to establish a long position. In addition, during the formation of the right shoulder, when the price drops to a certain extent without creating a new low and starts to show signs of a rebound, some more aggressive investors may also choose to enter the market in advance. Meanwhile, by combining other technical indicators (such as trading volume, moving averages, etc.), the reliability of the buying signal can be further confirmed, increasing the probability of a successful trade. Generally speaking, measure the vertical distance from the lowest point of the head to the neckline. Once the price breaks through the neckline, theoretically, the price is expected to rise by at least an amplitude equal to this vertical distance.
Calculation Method
How to predict how far of the stock price will rise through powerful technical analysis?
- Measure the vertical distance from the vertex of the lowest point of the head. As is shown in the chart, 39-30=9.
- Once the price breaks through the neckline, theoretically, the price is expected to rise by at least an amplitude equal to this vertical distance. 39+7=46, 46+9=55
In this part, we will use two cases. One is the case of 3M Company, and the other is the case of Pinduoduo.
Case1 MMM (2023-2024, Weekly Chart)

Calculation Method
How to predict how far of the MMM stock price will rise through powerful technical analysis?
- Measure the vertical distance from the vertex of the lowest point of the head. As is shown in the chart, 93-71=22.
- Once the price breaks through the neckline, theoretically, the price is expected to rise by at least an amplitude equal to this vertical distance. 93+22=115, 115+22=137
Case2 PDD (2022-2023, Weekly Chart)

How to predict how far of the stock price will rise through powerful technical analysis?
(1) Measure the vertical distance from the vertex of the lowest point of the head. As is shown in the chart, 70-30=40.
(2) Once the price breaks through the neckline, theoretically, the price is expected to rise by at least an amplitude equal to this vertical distance. 70+40=110
In this case, during the formation of the right shoulder, there was ultimately no effective breakthrough of the neckline. Subsequently, after a downward movement, the price rose again and then broke through the neckline, effectively establishing the pattern.
Interpretations of other chart patterns are available in chart patterns